Browse by Topic
Choose a subject:
Opportunity cost is the next best alternative forgone when a choice is made. K For example, if the UK government chooses to spend £50bn on the HS2 rail project, the opportunity cost is the hospitals, schools, or tax cuts that money could have funded instead. A Opportunity cost exists because of scarcity — if resources were unlimited, choosing one option would not require giving up another. A
Both terms must be defined precisely. Scarcity must reference the tension between unlimited wants and limited resources — not simply "things are rare." Opportunity cost must include "next best alternative forgone," not just "what you give up." The HS2 example grounds the answer in a real-world context, earning the application marks that push into the top band.
PED is important to firms because it determines the impact of a price change on total revenue. A For example, if a firm sells a product with inelastic demand (e.g. insulin), it can raise prices and increase revenue because the fall in quantity demanded will be proportionally smaller than the price rise. Conversely, a firm selling a product with elastic demand (e.g. a branded chocolate bar with many substitutes) would lose revenue by raising prices, as consumers would switch to alternatives. A
Full marks require a clear formula or verbal definition of PED and an explanation of why it matters to a firm — typically through its link to total revenue. Examiners reward candidates who distinguish between elastic and inelastic demand with concrete examples rather than just stating the definition.
One factor affecting PES is the availability of spare capacity. A Firms with excess capacity (e.g. unused machinery or factory space) can increase output quickly in response to a price rise, making supply more elastic. Conversely, a firm operating at full capacity would struggle to expand output in the short term. A
A second factor is the time period. A In the short run, supply tends to be inelastic because it takes time to hire additional workers, source raw materials, or build new production facilities. In the long run, firms can adjust all factors of production, making supply more elastic. A
Full marks require a clear definition of PES (not just "how supply changes") and two distinct, developed factors. Candidates who simply list factors without explaining how they affect PES will only reach 2–3 marks. The distinction between short run and long run is a reliable factor that examiners accept.
A fall in raw material costs shifts the supply curve to the right.
E.g. a fall in oil prices reduces production costs for plastics manufacturers.
At each price level, firms can now produce more profitably → supply shifts right → new equilibrium with lower price and higher quantity.
Consumers benefit from lower prices, firms may see higher revenue if demand is elastic, but profit impact depends on the extent of cost savings versus the price fall.
The chain is developed and in context: raw material costs fall → supply shifts right → price falls and quantity rises → consumer surplus rises. The oil price example supplies the application, and a supply and demand diagram would earn the diagram credit. What takes it into Level 4 is the assessment in paragraph 3: the revenue effect is not asserted but made conditional on PED, the opposite case is stated (inelastic demand, revenue falls), and it is then weighed against the cost saving. That brief assessment is the clause separating Examine from Analyse.
A maximum price set below equilibrium creates excess demand (a shortage).
E.g. rent controls in cities like New York or Berlin — rent capped below market rate.
At the lower price, Qd > Qs. Landlords reduce supply (less profitable), tenants increase demand (cheaper). The gap = shortage.
This leads to non-price rationing (waiting lists, discrimination) and potential black markets where the good trades above the legal price.
The chain is developed and in context: a ceiling below equilibrium → shortage → non-price rationing → black market → less long-run investment, with rent controls as the application, and a diagram showing Pmax below Pe would earn the diagram credit. It stops at Level 3 because the assessment is implied rather than made — every consequence runs one way and nothing is weighed. One or two sentences would lift it: that the size of the shortage depends on how elastic supply and demand are, and that the policy does protect the consumers who get the good, so the verdict turns on how it is rationed.
Much of the world’s electricity is still generated in coal-fired power stations, which release carbon dioxide and sulphur dioxide as they produce it.
For example, a coal-fired power station E emits carbon dioxide and sulphur dioxide as by-products of electricity production. Local residents and future generations suffer increased rates of respiratory illness and climate-related damage — costs they bear without compensation. A Because these social costs are external to the firm's calculations, the market over-produces electricity relative to the socially optimal output. A
Full marks require both a precise definition (spill-over cost, third parties, not in price) and a developed example that identifies the specific third-party harm. Vague answers like "pollution affects people" will only reach 2 marks. Linking over-production to the divergence between private and social cost pushes into top-band application.
An indirect tax raises the private cost of production, shifting supply left and reducing consumption.
E.g. the UK Soft Drinks Industry Levy (2018) — a two-tier tax on sugar content in drinks.
The tax internalises the external cost (obesity, NHS burden) by making the market price reflect the social cost, moving output closer to the socially optimal level.
This reduces the welfare loss from over-consumption of demerit goods, though effectiveness depends on PED and whether firms reformulate.
A developed chain: tax → supply shifts left → price rises → quantity falls → welfare loss narrows, applied to the Soft Drinks Industry Levy, with the tax wedge available for the diagram credit. Level 4 is earned in paragraph 3, where the answer does not leave the tax working: the outcome is made conditional on PED, the inelastic case in which the levy raises revenue rather than changing behaviour is stated, and reformulation is set against it. That is the brief assessment the command requires.
CPI measures inflation by tracking the prices of a representative basket of approximately 700 goods and services, weighted according to typical household spending patterns. A The basket is updated annually to reflect changing consumption habits — for example, streaming subscriptions have been added in recent years while DVD players have been removed. Prices are compared to a base year (index = 100). If the CPI rises from 100 to 103, this indicates an inflation rate of 3%. A
Full marks require both a definition of inflation (sustained rise in the general price level) and an explanation of the CPI method. Candidates should mention the basket of goods, weighting, and base year comparison. Simply stating "CPI measures prices" without explaining how earns only 1–2 marks.
Unemployment has different causes requiring different policy responses.
E.g. UK claimant count data shows regional variation linked to structural change in former industrial areas.
Cyclical unemployment arises from demand deficiency, structural from changing industry composition, frictional from job search, and seasonal from time-dependent demand patterns.
Identifying the type matters because each requires different policy — demand-side stimulus for cyclical, supply-side intervention for structural.
Structural unemployment arises from a mismatch between workers' skills and the skills demanded by employers, often caused by long-term changes in the structure of the economy. K For example, the decline of coal mining and manufacturing in northern England left many workers without the skills needed for new service-sector jobs. A Structural unemployment requires supply-side policies such as education, retraining programmes, and subsidies for geographical mobility. An
Four types, each with a cause, an example and the policy that fits it, with the 2008–09 recession and the decline of UK manufacturing as application. The Level 4 clause is the closing judgement rather than the list: expansionary demand-side policy is the right response to cyclical unemployment and the wrong one to structural, where it would raise inflation without raising employment. That is a brief assessment of competing policies, made rather than implied.
First, a cut in income tax would increase households' disposable income, leading to a rise in consumer spending (C). A With more income available after tax, consumers can afford to spend more on goods and services, shifting AD rightward. A
Second, a fall in the exchange rate would make exports cheaper for foreign buyers and imports more expensive for domestic consumers. A This would increase net exports (X − M), as export demand rises and import spending falls, shifting AD to the right. A
For full marks, candidates must identify two distinct factors and explain the mechanism by which each causes AD to shift right — not just state the factor. Linking each factor to a specific component of AD (C, I, G, or X−M) demonstrates application. Generic answers like "more spending" without explaining why spending rises will only score 1–2 marks.
Supply-side policies increase the productive capacity of the economy, shifting LRAS rightward.
E.g. government investment in education and training increases human capital; deregulation reduces barriers to entry.
Higher productivity means more output can be produced at every price level. LRAS shifts right, enabling non-inflationary growth.
This raises the trend rate of growth and reduces structural unemployment, though benefits take years to materialise.
A developed chain in context: policy → productivity and capacity rise → LRAS shifts right → non-inflationary growth and lower structural unemployment, across both interventionist and market-based measures, with an LRAS diagram available for the diagram credit. Level 4 is reached by the closing qualification, which sets the gain against its timing and its cost: the benefits take years to appear and carry short-run spending and transition costs. Brief — but it is an assessment.
The circular flow model illustrates how injections and withdrawals determine the level of national income.
E.g. government spending on the NHS adds income to the circular flow; saving by households withdraws income from it.
When injections (I + G + X) exceed withdrawals (S + T + M), national income rises through the multiplier effect. When withdrawals exceed injections, national income contracts.
This framework helps explain why changes in government spending, investment, or trade balances cause fluctuations in GDP.
The model is set out accurately and the chain is developed: injections and withdrawals defined, the multiplier mechanism explained with a concrete infrastructure example, and the equilibrium condition stated. A labelled circular flow diagram would earn the diagram credit. It stops at Level 3 because no assessment is made — the mechanism runs and nothing is weighed. Two sentences would lift it: the size of the change in national income depends on the marginal propensity to withdraw, so the same injection moves a high-tax, import-heavy economy far less than the bare model suggests.
Potential economic growth is an increase in the productive capacity of the economy — the maximum output it could produce at full employment. K This is represented by a rightward shift of the LRAS curve and is caused by supply-side improvements such as better technology, increased education and training, or investment in infrastructure. A
The key distinction is that a country can experience actual growth without potential growth (simply using up spare capacity through rising AD) or potential growth without actual growth (productive capacity expands but AD does not rise sufficiently to utilise it). A
Full marks require clear definitions of both types of growth and an explicit distinction. Linking actual growth to AD and spare capacity, and potential growth to LRAS shifts, demonstrates the AD/AS framework understanding that examiners reward. The final point — that one can exist without the other — is the analytical insight that earns top marks.
Supply-side policies increase productive capacity, enabling sustainable non-inflationary growth.
E.g. investment in education (raising human capital), deregulation (increasing competition), lower corporation tax (incentivising investment).
These policies shift LRAS rightward, increasing the economy's trend rate of growth without generating demand-pull inflation.
However, supply-side policies alone may be insufficient — demand must also rise to utilise expanded capacity, and benefits take years to materialise.
This essay reaches the top mark band through a structured, balanced evaluation with a conditional conclusion. The supply-side argument is well-developed with specific policy examples (education, deregulation, corporation tax). The Keynesian counter-argument using the 2008–09 crisis demonstrates strong application and analytical depth. The evaluation considers time horizon, economic context, and policy type — exactly the contextual factors examiners reward at AO4. The conclusion avoids a simplistic verdict, instead identifying the conditions under which supply-side policies are most and least effective. A relevant AD/LRAS diagram would strengthen AO3.
Lower interest rates reduce the cost of borrowing for households and firms.
E.g. mortgage repayments fall, freeing disposable income; firms face lower investment hurdle rates.
This raises Consumption (C) and Investment (I), two components of AD = C + I + G + (X−M).
Rising AD pushes equilibrium price level up, increasing demand-pull inflation — especially if near full capacity.
A developed chain: rate cut → borrowing costs fall → C and I rise → AD shifts right → demand-pull inflation, with an AD/AS diagram available for the diagram credit. The Level 4 clause is paragraph 3, which does not assert the inflation but sizes it: near full employment the AS curve is inelastic and the price effect is amplified, while in a deep recession the same shift mostly raises real output. That conditional is the brief assessment.
Fiscal policy can directly create jobs through government spending on infrastructure.
E.g. UK's HS2 rail project or the US stimulus under the American Recovery and Reinvestment Act.
Direct spending generates multiplier effects as workers' incomes are re-spent. Fiscal policy can also target specific depressed regions.
This makes fiscal policy especially effective for structural unemployment that monetary policy (economy-wide rate cuts) cannot target.
This answer reaches the top mark band by delivering a conditional, context-driven conclusion rather than a blanket verdict. Note how the evaluation paragraph introduces the ZLB constraint and the distinction between cyclical and structural unemployment — these are the contextual triggers examiners look for at AO4. The crowding out counter-argument is particularly well-developed. For full 20 marks, a relevant AD/AS diagram with clear labelling of the unemployment gap would further strengthen AO3.
Segmentation is useful because it allows a business to target its marketing mix more precisely at each group, rather than adopting a one-size-fits-all approach. A For example, a car manufacturer can design and promote different models for families (MPVs with large boot space), young professionals (sporty hatchbacks), and luxury buyers (premium saloons with high-end features). A By tailoring products and marketing to each segment's specific needs, the business increases the likelihood of sales and can build stronger customer loyalty, ultimately boosting revenue and market share. A
Full marks require a clear definition of market segmentation and a developed explanation of why it benefits a business. Candidates should go beyond simply listing segmentation bases (age, income, etc.) and explain the advantage — targeted marketing leads to better customer satisfaction and higher sales. A concrete example, as shown here with the car manufacturer, earns the application marks.
Primary market research provides specific, up-to-date data tailored to the business's needs.
E.g. a tech start-up surveying 500 potential customers about product features before launch.
The data is exclusive to the firm, directly relevant, and can target the exact demographic. However, it is expensive, time-consuming, and small samples may not be representative.
The business must weigh the cost and time investment of primary research against the risk of launching a product based on incomplete or outdated secondary data.
Benefits and limitations are both developed rather than listed, and both sit in the launch context, with the tech start-up survey as application. Level 4 is earned because the competing factors are set against each other rather than stacked: cost and time are weighed against the launch risk the research removes, and social desirability bias is followed through to its consequence — a stated purchase intention is not a purchase. That awareness of competing arguments is what Discuss asks for beyond Analyse.
First, promotion would be critical for a new clothing brand, as it needs to build brand awareness among its target market. A The brand could use social media marketing — such as Instagram and TikTok influencer collaborations — to reach younger demographics cost-effectively, generating interest and driving traffic to its website. A
Second, price could be used strategically through penetration pricing — setting initially low prices to attract customers and build market share. K For a new brand competing against established rivals, competitive pricing gives consumers an incentive to trial the product, and once brand loyalty is established, prices can be gradually raised. A
Full marks require two clearly distinct elements of the marketing mix, each applied to the context of a new clothing brand. Examiners penalise generic answers that don't reference the business context. Note how this answer names specific promotional channels (Instagram, TikTok) and a specific pricing strategy (penetration pricing) — this level of detail earns the application marks.
For businesses, this means that simply paying a fair wage (physiological/safety) is not enough to fully motivate employees. A Once basic needs are met, managers should focus on creating a positive team environment (social needs), offering praise and promotion opportunities (esteem), and providing challenging, meaningful work (self-actualisation) to maximise motivation and productivity. A
Name all five levels for full knowledge marks. The application should link at least two levels to specific workplace examples. Avoid simply describing the theory without explaining its relevance to a business.
A key advantage of internal recruitment is that it is faster and cheaper. A There is no need to advertise externally, screen large numbers of applicants, or conduct lengthy induction training. The internal candidate already understands the company culture, systems, and processes, meaning they can become productive more quickly. An
Internal recruitment also motivates existing staff. A When employees see that promotion opportunities exist, they are incentivised to perform well and remain loyal to the company, reducing staff turnover and associated recruitment costs. This links to Maslow's esteem needs — recognition through promotion fulfils employees' desire for status and achievement. An
However, internal recruitment has a narrower talent pool, meaning the business may miss out on candidates with fresh perspectives, specialist skills, or experience from other industries. An It can also create a chain reaction of vacancies — promoting one employee creates a gap in their previous role that must also be filled. A
The advantages are developed in context — speed, cost, a candidate who already knows the systems, and the motivation effect linked to Maslow's esteem needs. Level 4 is earned because the answer does not stop at the advantages the question named: the narrower talent pool, and the chain of vacancies one promotion creates, are set against them. Discuss requires that brief assessment of competing factors, and this answer makes it rather than implying it.
The entrepreneur has several key roles. First, they are a risk-taker — they invest their own capital (or borrow funds) with no guarantee of return, accepting the possibility of financial loss. A Second, they are an innovator, identifying gaps in the market or developing new products and processes. For example, an entrepreneur might spot growing demand for plant-based food and launch a vegan restaurant. A Third, they are a decision-maker who coordinates resources, manages staff, and sets the strategic direction of the business. A
Define the term first, then explain at least two distinct roles with development. A concrete example (even a brief one) pushes the answer into the top band by demonstrating application.
Personal savings are often the most accessible source because they do not require approval from a third party and involve no interest payments or loss of ownership. A However, the amount available is limited by the entrepreneur's personal wealth, which may be insufficient to cover start-up costs such as premises, equipment, and initial stock. An
Bank loans provide a larger lump sum, but banks may be reluctant to lend to start-ups due to the high failure rate — approximately 60% of UK start-ups fail within the first three years. A If approved, the entrepreneur must provide collateral (personal assets as security) and make fixed monthly repayments regardless of whether the business is generating revenue, creating cash flow pressure in the early months. An
Venture capital or angel investment offers substantial funding and often includes business expertise and mentoring. A However, investors typically demand an equity stake, meaning the entrepreneur loses a share of ownership and future profits. This trade-off may be worthwhile if the investor's contacts and experience significantly increase the business's chances of survival. An
Three sources, each developed in the start-up context rather than described generically, with the failure rate explaining why banks are cautious. Level 4 is earned because each source is weighed rather than presented: savings against the limit of personal wealth, a loan against fixed repayments that start before revenue does, venture capital against the equity given up — and that last trade-off is judged, not merely stated. That is the brief assessment Discuss asks for.
Break-even analysis shows a start-up the minimum output needed to cover costs.
E.g. a new café calculating that it must sell 200 coffees per day at £3.50 to cover rent, staff and ingredients.
This helps with pricing decisions and gives banks confidence when assessing loan applications, as it shows financial awareness.
However, break-even assumes constant costs and prices, which may not hold for a start-up facing uncertain demand and changing supplier costs.
Break-even is applied to a real start-up decision, with the café calculation giving the application and the link to loan applications giving the context. Level 4 is earned in paragraph 3, where the limitations are explained rather than listed: the assumption that all output is sold is set against a start-up's uncertain demand, and the model's silence on the timing of cash is set against a business that can break even on paper and still fail. Competing factors, weighed.
Liquidity is crucial because even a profitable business can fail if it cannot pay its bills on time. A A business must have sufficient cash or near-cash assets to cover day-to-day expenses such as supplier invoices, wages, rent, and loan repayments. If it cannot, suppliers may refuse to deliver, staff may leave, and creditors may take legal action — potentially forcing the business into insolvency. A
The key distinction examiners look for is that profit and liquidity are not the same thing. A business can be profitable on paper but cash-poor in practice. Mentioning this explicitly earns top marks.
One approach is to reduce credit terms offered to customers — for example, changing from 60-day to 30-day payment terms. A This accelerates cash inflows, but risks losing customers who prefer longer credit periods, particularly in B2B markets where extended credit is standard practice. An
A business could also negotiate longer payment terms with suppliers, delaying cash outflows. A This effectively uses the supplier as a source of free short-term finance. However, this may damage the relationship with suppliers, who might respond by increasing prices or prioritising other customers' orders. An
Another method is sale and leaseback of assets — selling owned assets (e.g. vehicles, property) and leasing them back. A This provides an immediate cash injection but creates an ongoing lease expense that increases costs in the long run. The business also loses the asset from its balance sheet, which may affect its ability to secure future loans using those assets as collateral. An
Three methods, each developed to a consequence rather than named. Level 4 is earned because every one carries its own counterweight: shorter credit terms against the customers they cost, longer supplier terms against the relationship they damage, sale and leaseback against the ongoing lease charge and the collateral surrendered. Three trade-offs made explicitly is the brief assessment Discuss requires.
A major benefit is the reduction in stockholding costs — the business saves on warehousing, insurance, and the risk of stock becoming obsolete or damaged. A This frees up working capital that can be invested elsewhere in the business, improving cash flow and profitability. Lean methods also encourage a culture of continuous improvement (kaizen), where employees identify and eliminate inefficiencies. An
However, JIT is highly vulnerable to supply chain disruptions. A If a supplier delivers late or a key component is unavailable, the entire production line can halt because there is no buffer stock to absorb the delay. This was demonstrated during the COVID-19 pandemic when global supply chain disruptions caused major production stoppages for manufacturers using JIT. An JIT also requires reliable, flexible suppliers who can deliver small quantities frequently, and a highly organised production schedule. These conditions are easier to achieve for large firms like Toyota (which pioneered JIT) than for small businesses with less bargaining power over suppliers. An
JIT is explained and applied, with COVID-19 supply chain disruption and Toyota giving real application. Level 4 is earned because the benefit is set against the condition it depends on: the stockholding saving is weighed against having no buffer stock when a supplier fails, and the method is judged easier for a firm with Toyota's bargaining power than for a small business with none. That conditional judgement is the assessment of competing factors.
Higher interest rates increase borrowing costs for both the business and its customers.
E.g. a UK high-street fashion retailer sees reduced consumer spending as mortgage costs rise.
Consumers have less disposable income → demand for non-essential goods falls → revenue declines. The business also faces higher loan repayments on any variable-rate debt.
The severity depends on whether the retailer sells necessities or luxuries, and whether it is heavily leveraged.
This answer reaches the top band by providing a nuanced, context-sensitive evaluation. Note how it distinguishes between different types of retailers (fashion vs supermarket vs luxury) — this is the contextual depth examiners reward at AO4. The evaluation considers magnitude, type of retailer, and consumer expectations. The conclusion avoids a blanket verdict by identifying the conditions under which the impact would be most and least severe. For full 20 marks, using specific data (e.g. Bank of England base rate changes) would further strengthen AO2.
Economic growth can be shown as a movement toward the PPF or an outward shift of the entire curve.
E.g. China's massive infrastructure investment in the 2000s expanded productive capacity.
A movement from inside the PPF represents actual growth (using spare capacity). An outward shift represents potential growth — the economy can now produce more of both goods.
This distinction helps explain why some growth is inflationary (near the PPF) and some is sustainable (shifting the PPF).
The distinction between actual growth (a movement toward the frontier) and potential growth (an outward shift) is correct and developed, China supplies the application, and a labelled PPF showing both would earn the diagram credit. The trade-off between capital and consumer goods is analysis of the model rather than assessment of the argument, so this sits at Level 3. A Level 4 needs a brief assessment: the PPF shows the capacity to grow, not whether that capacity is used, so an outward shift is a potential gain only if aggregate demand rises with it.
YED helps firms predict how demand for their products will change as the economy grows or enters recession.
E.g. luxury car brands like BMW face elastic YED; budget supermarkets like Aldi have negative YED.
During a boom, firms with high YED products see demand surge. During recession, they face sharp falls — so they may diversify into lower-YED products to stabilise revenue.
Understanding YED allows firms to make informed decisions about product mix, pricing strategy, and risk management across the business cycle.
Four distinct business uses of YED — forecasting, product portfolio, marketing spend and capacity planning — each developed, with the BMW and Aldi contrast giving strong application. It stays at Level 3 because the usefulness is asserted throughout and never assessed. A Level 4 needs one qualification: YED values are estimates from past data and move with tastes, and a pricing decision needs PED as well, so YED informs the decision rather than making it.
If the price is above equilibrium, there is excess supply — producers cannot sell all their output, so they reduce prices. A If the price is below equilibrium, there is excess demand — consumers compete for limited goods, bidding the price up. A In both cases, the price mechanism automatically adjusts the market toward equilibrium.
Clear and precise. The definition correctly identifies Qd = Qs and the concept of no tendency to change. The explanation of adjustment from above and below equilibrium demonstrates understanding of the price mechanism in action.
Full marks require the concept plus an applied example from the stimulus: the plastic bag, whose litter is a cost to others, or second-hand smoke from tobacco. A common mistake is to define a production externality, such as the emissions of the factory that makes the bags.
Full marks: both costs are defined and the relationship between them is stated, then the extract’s WHO figures are used to separate them — the 1.6 million non-smokers are the external cost, not all 7 million deaths — and the people who bear it are named. An answer that says "smoking harms other people" without the figures misses the first application mark, and one that treats all 7 million deaths as external has misread the extract and misses it too. Explain asks for no evaluation — whether the 100% excise covers the external cost is a different question.
Full marks, because the extract’s figures are interpreted rather than quoted: the falls of approximately 40% and more than 20% are read as a strong response to a small charge on a bag that had been free, and the shoppers who kept paying show what a charge removes and what it leaves. An answer that explains the theory of Pigouvian taxes but stays generic and quotes no data misses both application marks. Analyse does not reward evaluation, so judging whether AED 0.25 was high enough, or comparing the charge with Abu Dhabi’s ban, would earn nothing here — that is part (d).
Full marks. The answer states what each tool does before comparing them, which makes 90% to 95% against 40% an argument rather than an observation. The analysis explains why a charge leaves some over-consumption and why a ban can overshoot, each carried to a welfare loss, and uses the AED 0.50 reusable-bag price to show what the Abu Dhabi figure really measures. Two brief assessments, each with a reason from the extract, earn the evaluation marks; a verdict with no reason ("it depends") would not.
Top of both levels. Knowledge is precise and every chain runs through the extract: the Saudi 110% and 35% are turned into an elasticity, Table 1’s tiers show how reformulation escapes the tax, and the UK’s 46% is used as evidence that it happens. The evaluation recognises the opposing viewpoint fairly and is critical of the evidence — the UAE study, the diabetes figure and the size of a per-litre tax on a can are each weighed rather than quoted. A Discuss does not require the long conditional verdict an Evaluate essay does; the short conclusion here follows from the argument and introduces nothing new.
A negative externality causes the market to overproduce because the price does not reflect the full social cost.
E.g. a steel factory discharging pollutants into a river — harming fisheries downstream.
The producer only considers private costs (raw materials, wages). The external cost (pollution damage) is not included in the price, so the market price is too low and output too high relative to the social optimum.
This misallocation of resources creates a deadweight welfare loss — society would be better off producing less.
The chain is developed and correct: external cost → MSC above MPC → price too low → overproduction → deadweight welfare loss, with the steel factory as application and the welfare loss triangle available for the diagram credit. It earns the knowledge, application and analysis marks and neither evaluation mark, because the assessment is implied rather than made — the Pigouvian tax in the final paragraph is offered as a remedy, not weighed. The two evaluation marks need a brief assessment: how large the misallocation is, and whether intervention improves on it, depends on whether the external cost can actually be valued, and pollution damage rarely can be valued precisely.
‘Many governments now tax sugary drinks, pay for public goods such as flood defences and street lighting, and require financial firms to disclose their fees. Critics argue that some of these interventions cost more than the market failures they were meant to correct.’
Government intervention can correct externalities, provide public goods, and address information failure.
E.g. the UK's sugar tax was followed by a fall of about a third in the sugar sold in the drinks it covers, mostly through reformulation.
Intervention internalises external costs (taxes), funds provision of public goods (taxation), and corrects information asymmetry (regulation, labelling).
However, intervention is not always necessary or effective — private solutions (Coase theorem) may work, and government failure can make outcomes worse.
This answer earns a high mark through its conditional, nuanced conclusion — not simply "yes" or "no" but "it depends on the type of failure and the quality of intervention." The sugar tax and Coase theorem examples provide strong application. The government failure section with information failure, regulatory capture, and unintended consequences is sound evaluation, but its four objections are stated a sentence each rather than weighed, which holds it below full marks. The final sentence — comparing costs of government failure with costs of market failure — is exactly the evaluative framework examiners reward.
Measles spreads easily from person to person. A child who is vaccinated against it is protected, and so are the people around them who cannot be vaccinated, such as babies too young for the vaccine.
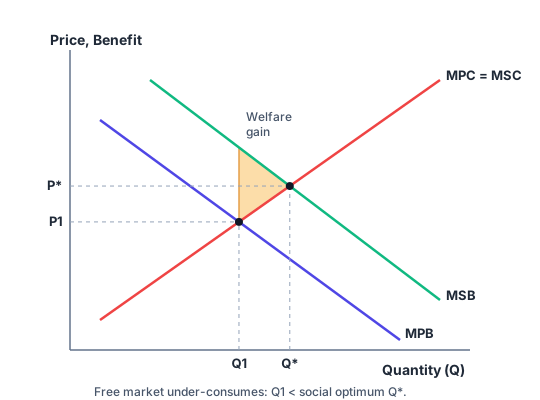 The vertical axis is price, cost and benefit; the horizontal axis is the quantity of vaccinations. Marginal private benefit (MPB) slopes down and marginal private cost, which equals marginal social cost (MPC = MSC), slopes up; the free market settles where they cross, at quantity Q1. Marginal social benefit (MSB) lies above MPB: the vertical gap is the external benefit to people protected by someone else’s vaccination, such as babies too young to be vaccinated. The social optimum is where MSB = MSC, at Q*, to the right of Q1: left to the free market, too few vaccinations are bought. The welfare gain the free market misses is the triangle between Q1 and Q*, bounded above by MSB and below by MSC: the vaccinations whose social benefit exceeds their cost but which the market does not provide.
All four marks are on the diagram; the sentences under it say what each mark is for and are not needed in the exam. The commonest loss is drawing MSB below MPB — that is the diagram for an external cost of consumption, and it puts the shaded area on the wrong side of the market quantity. The next is shading the whole area between the curves instead of the triangle between the market quantity and the social optimum.
Economists in one country estimate the yearly benefits of one extra university graduate, averaged over the graduate’s working life.
- Benefit per graduate per year
- Higher earnings received by the graduate
- USD
- 12,000
- Benefit per graduate per year
- Higher productivity of the people the graduate works with, received by their employers and co-workers
- USD
- 4,500
Full marks with the working shown. The knowledge mark is for the relationship, which is also what tells you which two figures to add. The common slip is dividing by the private benefit instead of the social benefit (4,500 ÷ 12,000 = 37.5%), which answers a different question.
A coastal city is building a sea wall that will protect every home and business behind it from flooding. Hardware shops in the city also sell sandbags, which a household can pile against its own door.
Full marks: both characteristics are defined, and each is then shown on the context rather than restated. "The sea wall benefits everyone" earns nothing on its own — the marks are for saying why protecting one more house costs its neighbours nothing, and why a household that does not pay cannot be left out.
Workers who save for retirement in a private pension fund pay yearly fees that are set out in long documents, and they find out how well the fund has performed only after decades of saving.
Full marks. The definition names who knows more — the provider — rather than saying information is "imperfect", and the application uses both details in the context: fees in long documents, and results revealed only after decades. The last clause is what the question asks for and many answers stop short of: where resources actually go when savers cannot tell good funds from bad.
‘In March 2023, after two regional banks in the United States failed, the authorities guaranteed all of their customers’ deposits, including balances above the USD 250,000 that deposit insurance normally covers.’
Top of both levels. The definition of moral hazard is precise, and each side of the argument is a multi-stage chain that ends in an effect on the allocation of resources or on firms and workers, not in "this is bad". The context is used as evidence: the USD 250,000 limit shows how far the 2023 guarantee went, and who held the uninsured deposits is what makes it a moral-hazard case. The evaluation weighs design, expectations, who pays and time rather than listing them, and the conclusion states the criterion the judgement rests on — whether protection is limited, priced and matched by regulation.
A government can set an indirect tax equal to the external cost per unit. This forces producers to internalise the externality — their private cost now includes the external cost, raising the supply curve to align with the marginal social cost. A Output falls from the free market level to the socially optimal level, and the welfare loss is eliminated. For example, the UK's landfill tax raises the cost of sending waste to landfill, encouraging recycling and reducing environmental damage. A
Precise definitions followed by clear mechanism (tax = external cost, internalise, output falls to social optimum). The landfill tax example provides concrete application. Avoid saying "the government taxes the externality" — instead say "the tax equals the external cost per unit."
Second, the CPI is slow to include new products and may not capture quality improvements. K If a smartphone costs the same as last year but has significantly better features, the true cost per unit of quality has fallen — but the CPI records no change. This means CPI may overstate inflation by ignoring quality-adjusted price falls. A
Two distinct limitations, each with development. The basket composition and quality adjustment points are the two most commonly rewarded answers. Avoid vague limitations like "it is inaccurate" — always explain why.
Lower interest rates reduce the cost of borrowing and the incentive to save, boosting consumption and investment.
E.g. the Bank of England cut rates to 0.1% during COVID-19 to support spending.
Cheaper mortgages increase disposable income → more consumer spending. Lower borrowing costs make investment projects more profitable → more business investment. A weaker pound boosts net exports.
Through these channels, lower rates increase multiple components of AD, shifting the curve right.
Three transmission channels — consumption, investment, and the exchange rate through net exports — each developed into its own chain, with the 0.1% COVID-19 cut as application. It stops at Level 3 because each channel is asserted to work and none is qualified. A Level 4 needs one brief assessment: the size of the shift depends on confidence, and if households and firms expect worse to come, a cheaper loan is pushing on a string.
For example, a sharp rise in oil prices increases energy and transport costs for firms across all sectors, reducing SRAS. A Similarly, a weaker exchange rate increases the cost of imported raw materials, or a rise in the national minimum wage increases labour costs. A In each case, higher costs shift SRAS left, causing cost-push inflation and potentially stagflation.
Clear definition followed by three concrete examples (oil prices, exchange rate, minimum wage). Each example is linked to the mechanism. Mentioning stagflation shows awareness of the consequences.
An initial injection of spending creates successive rounds of income and expenditure, magnifying the impact on GDP.
E.g. the UK government's £400bn COVID support packages aimed to stimulate the economy via the multiplier.
Each round of spending generates income, but leakages (savings, taxes, imports) remove money from the circular flow, so each round is smaller than the last.
The size of the multiplier depends on the marginal propensity to consume — in an open economy with high taxes and import spending, the multiplier is much smaller.
The mechanism is developed concretely, and the £1bn → £800m → £640m walkthrough makes the rounds of spending visible. Level 4 is earned because the answer then assesses the mechanism rather than trusting it: leakages through saving, tax and imports are set against the theoretical value, the practical UK multiplier of 1.3–1.5 is contrasted with the textbook 5, and the capacity constraint is added as a further limit. That is a brief assessment, made.
Consumer spending typically accounts for 60–65% of GDP, making it the largest component of AD.
In the UK, household spending represents approximately 63% of GDP.
When consumer confidence rises, the multiplier effect amplifies spending into higher GDP growth. Conversely, a fall in confidence can trigger a recession.
However, consumption-driven growth is demand-side only. Long-run sustainable growth requires investment in productive capacity — which depends on I, not C.
Top-band answer. The 63% GDP figure provides immediate authority. The short-run vs long-run distinction is the key evaluative framework. China's investment-led growth and UK's debt-fuelled growth are strong contrasting applications. The conclusion avoids a simple yes/no — instead distinguishing by time horizon, which is exactly what examiners reward at AO4.
Rapid growth can cause inflation, environmental degradation, and increased inequality.
E.g. China's rapid industrialisation caused severe air pollution in cities like Beijing.
If AD grows faster than productive capacity, demand-pull inflation results. Growth concentrated in certain sectors/regions widens inequality.
These costs mean that maximising growth is not always desirable — the quality and sustainability of growth matters as much as its speed.
Three costs — inflation, environmental degradation and inequality — each developed into a chain and each applied, with UK inflation in 2021–22 and the health cost of China's industrialisation as evidence. It sits at Level 3 because the costs are set out and never weighed: nothing says which is the most serious, and nothing sets them against the benefits growth also brings. The plan's Link sentence reaches the judgement — that the quality of growth matters as much as its speed — but the answer itself never says it. Writing that sentence into the final paragraph is the Level 4 clause.
For example, purchasing economies allow large firms like Tesco to negotiate bulk discounts from suppliers — buying 10 million units at a lower price per unit than a small corner shop. A Technical economies enable large car manufacturers like Toyota to invest in robotic assembly lines that reduce labour costs per vehicle — an investment that would be uneconomical for a small producer. A
Clear definition that correctly identifies falling average costs (not just falling costs). Two named types with real-world firm examples. Avoid saying "the firm saves money" — instead say "average costs fall" or "unit costs decrease."
MC = MR is the output where the additional revenue from one more unit exactly equals the additional cost — producing more or less would reduce profit.
Any firm — from a coffee shop to Amazon — implicitly applies this rule when deciding production levels.
If MC < MR, producing one more unit adds more to revenue than cost → profit rises. If MC > MR, the extra unit costs more than it earns → profit falls. Only at MC = MR is profit maximised.
This is the universal profit-maximising rule that applies across all market structures.
The logic is exact and complete: below MC = MR expand, above it contract, at it neither, and the rule holds across market structures because only the shape of the revenue curve changes. A diagram with the profit area shaded would earn the diagram credit. It is Level 3 because no assessment is made. A Level 4 needs one: firms rarely know their marginal curves, and many pursue sales, growth or market share instead, so MC = MR is the benchmark rather than the behaviour.
Monopoly can harm consumers through higher prices and allocative inefficiency, but may benefit them through economies of scale and innovation.
E.g. Google dominates search but provides a free, constantly improving service.
Supernormal profit can fund R&D (dynamic efficiency). Economies of scale can lower average costs below what smaller firms could achieve. Natural monopolies may be the most efficient structure.
Whether monopoly is harmful depends on the source of monopoly power, the degree of contestability, and the effectiveness of regulation.
Top-band answer with excellent structure. The Schumpeterian argument for dynamic efficiency is well-developed. Google and energy companies provide contrasting applications. The evaluation correctly identifies contestability, regulation, and source of power as the key determinants. The conclusion avoids a binary answer — instead framing the issue as "how to regulate" rather than "whether to allow." For full marks, include a monopoly diagram showing deadweight loss and reference the CMA.
For example, if demand for electric vehicles increases, car manufacturers like Tesla will hire more production workers, engineers, and battery technicians — the demand for these workers is derived from consumer demand for EVs. A Conversely, falling demand for print newspapers has reduced the derived demand for journalists and printers in that industry. A
Clear definition that correctly links labour demand to product demand. Two contrasting examples (Tesla EVs rising, print newspapers falling) show understanding in both directions. Avoid saying "firms need workers" without explaining why — always link back to product demand.
A monopsony faces an upward-sloping supply curve, meaning the marginal cost of labour exceeds the wage.
E.g. the NHS is the dominant employer of nurses in the UK.
To hire one more worker, the monopsonist must raise wages for all workers → MCL > W. It employs where MCL = MRP but pays the lower wage on the supply curve.
This results in both lower wages and fewer workers employed compared to a competitive labour market.
The mechanism is developed and correct, and the key insight is stated rather than assumed: MCL exceeds the wage because hiring one more worker raises the wage of everyone already employed. The NHS application is apt and a monopsony diagram would earn the diagram credit. It sits at Level 3 because the result is derived and never assessed. A Level 4 needs a brief assessment: a trade union or a minimum wage can raise both the wage and employment here, which is the opposite of their effect in a competitive labour market, so how much monopsony power the employer really has is what the outcome turns on.
A potential benefit is improved efficiency. Private firms are driven by the profit motive, giving them an incentive to cut costs and increase productivity. A For example, the privatisation of British Telecom (BT) in 1984 led to significant investment in network infrastructure and technological innovation that may not have occurred under slower-moving state ownership. A
Clear definition with correct emphasis on ownership transfer from public to private sector. The BT example provides concrete application. Linking the profit motive to efficiency is the key mechanism.
Second, technological advances — particularly the internet, containerisation, and cheaper air transport — have reduced the cost and time of moving goods, services, and information across borders. K Containerisation alone reduced shipping costs by over 90%, making it viable for firms to source components globally and sell to international markets. A
Two distinct causes, each with development and data/context. Trade liberalisation and technology are the two most commonly cited causes and provide a strong answer. Avoid listing causes without explanation — always show the mechanism.
MNCs bring capital, jobs, and technology but may also exploit cheap labour and repatriate profits.
E.g. Nike's operations in Vietnam — created 300,000+ jobs but faced criticism over working conditions.
FDI creates direct and indirect employment, raises tax revenue, and transfers technology. But profits leave the country, jobs may be low-skill, and local firms may be crowded out.
The net impact depends on the host country's regulatory framework and bargaining power.
Benefits and costs are each developed into chains and each applied, with Nike in Vietnam carrying both sides. Level 4 is earned because the answer weighs rather than balances: employment and technology transfer are set against profit repatriation, weak labour standards and the crowding out of domestic firms, and the closing judgement makes the net effect conditional on the host country's regulatory framework and bargaining power.
Free trade allows specialisation according to comparative advantage, increasing global output and consumer choice.
E.g. EU single market trade increased member GDP by an estimated 8–9% over 50 years.
Countries produce what they are relatively best at and trade for the rest. Consumers benefit from lower prices and greater variety. Competition drives innovation.
However, free trade creates winners and losers within countries — and developing countries may need temporary protection to build competitive industries.
Excellent answer. The EU GDP estimate and South Korea industrial policy examples provide authoritative application. The evaluation section is outstanding — considering distributional effects, Brexit backlash, and COVID supply chain vulnerability shows exactly the contextual depth examiners reward. The "managed liberalisation" conclusion avoids simplistic yes/no and proposes a nuanced policy position.
One possible cause is a strong (overvalued) exchange rate. When the pound is strong, UK exports become more expensive for foreign buyers (reducing export demand) while imports become cheaper for UK consumers (increasing import spending). A This combination of falling exports and rising imports widens the current account deficit. A
Precise definition covering all current account components. The exchange rate mechanism is clearly developed — strong pound → expensive exports + cheap imports → deficit widens. Avoid saying "the country imports too much" — instead explain the mechanism driving the imbalance.
The Lorenz curve shows cumulative income shares; the Gini coefficient summarises the gap between perfect equality and reality.
E.g. South Africa has a Gini of ~0.63 (very unequal) vs Sweden at ~0.27 (relatively equal).
The further the Lorenz curve bows from the 45° line, the greater the inequality. The Gini = area between the line and curve / total area under the line.
Both tools are useful for comparing inequality between countries and tracking changes over time, though they have limitations.
Both measures are explained with correct technical detail and made concrete by South Africa against Sweden; a sketched Lorenz curve would earn the diagram credit. Level 4 is earned by the third paragraph, which assesses the tools rather than using them: the Gini hides where in the distribution the inequality sits, both measures ignore wealth, and both depend on data that a large informal economy distorts. Three limitations, each developed.
Second, primary product dependency makes countries vulnerable to volatile commodity prices. K Countries like Nigeria, which relies heavily on oil exports, experience boom-and-bust cycles — when oil prices fall, government revenue collapses and development spending is cut. A Reliance on a narrow export base also means the country fails to develop diversified manufacturing and services sectors needed for sustained development.
Two distinct barriers with clear mechanisms. Corruption links to misallocation of resources and deterrence of FDI. Primary product dependency links to price volatility and lack of diversification. Nigeria provides concrete application.
Trade provides sustainable income and incentivises productivity growth, while aid can create dependency.
E.g. Vietnam's export-led growth lifted millions out of poverty; some aid-dependent African economies have not seen comparable gains.
Trade integrates countries into global supply chains, attracts FDI, builds human capital, and generates tax revenue sustainably. Aid fills short-term gaps but may distort local markets and reduce incentives for reform.
The most effective approach combines market access for developing country exports with targeted aid for infrastructure and institutions.
Both sides are developed, with Vietnam's integration into global supply chains giving the application. Level 4 is earned because the answer reaches a judgement instead of alternating: trade's advantage is that the income is self-generating, but market access is not guaranteed, and aid builds the infrastructure without which a country cannot export at all — so the two are complements, and the answer says which combination it prefers. That is the brief assessment the command asks for.
Niche markets allow firms to charge premium prices and face less competition, but limit growth potential.
E.g. Lush operates in the niche of handmade, ethical cosmetics.
Less competition means higher margins, but a small customer base makes the firm vulnerable to changes in consumer tastes or new entrants.
Whether niche is advantageous depends on the firm's ability to build loyalty and defend its position.
Advantages and disadvantages are both developed, with Lush carrying the application throughout. Level 4 is earned because the disadvantages are weighed against the advantages rather than added after them: premium pricing and low direct competition are set against the loss of economies of scale and, more sharply, against the vulnerability of the whole model if a large firm enters the niche. The closing judgement — that it depends on the firm's ability to defend its position — completes the assessment.
The product life cycle shows how sales change over time, requiring different marketing approaches at each stage.
E.g. Apple uses extension strategies (new colours, features) to extend the iPhone's maturity phase.
At launch, heavy promotion builds awareness. In growth, distribution expands. In maturity, differentiation and extension strategies maintain sales. In decline, the firm harvests profits or withdraws.
Understanding the life cycle helps firms allocate marketing budgets efficiently and plan product development.
All four stages are covered and each is tied to a specific marketing action, with Apple's iPhone extension strategy giving a strong application. It stops at Level 3 because the model is applied and never assessed. A Level 4 needs a brief assessment of the model itself: the PLC describes a pattern rather than predicting one, the length of each stage is only knowable afterwards, and an extension strategy can restart the cycle — so it guides a marketing budget rather than setting it.
Financial incentives (bonuses, commission, profit sharing) directly reward output and can boost short-term productivity.
E.g. Amazon warehouse workers receive productivity bonuses, but high turnover suggests financial incentives alone are insufficient.
Taylor argued that workers are primarily motivated by money. Herzberg distinguished between hygiene factors (pay) that prevent dissatisfaction and motivators (recognition, responsibility) that drive true motivation.
The effectiveness of financial incentives depends on the nature of the work, the level of the employee, and the organisational culture.
Top-band answer integrating three motivation theories (Taylor, Herzberg, Maslow) with contrasting business examples (Amazon vs Google). The 150% turnover statistic is powerful evidence. The conclusion correctly identifies financial incentives as necessary but not sufficient — exactly the nuanced position examiners reward. For full marks, consider adding how cultural context (e.g. collectivist vs individualist societies) affects the relative importance of financial incentives.
Entrepreneurs need a combination of risk tolerance, creativity, and resilience to overcome the challenges of starting a business.
E.g. James Dyson spent 15 years developing 5,127 prototypes before his bagless vacuum succeeded.
Starting a business involves financial risk, uncertain demand, and frequent failure. Without resilience and willingness to take calculated risks, most ventures would never launch.
The relative importance of each quality depends on the industry, market conditions, and the stage of the business.
Five qualities, each tied to a real start-up difficulty, with Dyson's 5,127 prototypes making persistence concrete. It sits at Level 3 because the qualities are listed and never weighed against each other. The plan's Link sentence says their relative importance depends on the industry and the stage of the business — but the answer never makes that point. Writing it in, and naming one quality as the most fundamental with a reason (without risk tolerance the business never starts at all), is the brief assessment that reaches Level 4.
External sources come from outside the business and involve either borrowing or giving up equity. K Examples include bank loans (fixed repayment schedule with interest), share capital (selling ownership stakes), and venture capital (investment from specialist firms in exchange for equity). A Internal finance avoids interest payments and loss of control, but may be limited in amount. External finance provides larger sums but comes with obligations.
Clear distinction with named examples for each. Correctly identifies the trade-off (no interest vs limited amount). Avoid listing sources without categorising them — the question asks for the difference.
It is calculated as: Break-even = Fixed costs ÷ (Selling price – Variable cost per unit). K For example, if fixed costs are £10,000, the selling price is £20, and the variable cost per unit is £10, the break-even output is £10,000 ÷ (£20 – £10) = 1,000 units. A This tells the business the minimum it must sell to cover all costs.
Precise definition, correct formula (contribution method), and a worked numerical example. The explanation of what happens above and below break-even shows understanding of the concept, not just the calculation.
Low capacity utilisation is a problem because fixed costs are spread over fewer units, raising the average cost per unit. K A factory paying £100,000 in rent produces at £10 per unit at full capacity (10,000 units) but £16.67 per unit at 60% (6,000 units). A This makes the firm less competitive and reduces profit margins.
Clear definition with formula and numerical example. The fixed cost per unit calculation makes the problem concrete — £10 vs £16.67 per unit is immediately convincing. Avoid just saying "costs increase" — show why using the fixed cost/output relationship.
A business can be profitable on paper but fail if it runs out of cash to pay day-to-day obligations.
E.g. Carillion was reporting profits right up until its collapse in 2018 — its cash flow was deeply negative.
Profit is an accounting measure over a period. Cash flow is the actual movement of money — if a firm cannot pay wages, suppliers, or rent on time, it becomes insolvent regardless of its profit position.
In the short run, cash flow is critical for survival. In the long run, sustained profitability is what generates the cash flow needed for growth.
Excellent answer. The Carillion case study is perfectly chosen — profitable on paper, collapsed due to cash flow. Amazon provides the counter-example (loss-making but cash-supported). The evaluation distinguishes by business stage and industry, which is the contextual depth examiners reward. The conclusion's final sentence is powerful and memorable.
As firms grow beyond their optimal size, coordination becomes increasingly difficult and average costs rise.
E.g. HSBC's global operations across 60+ countries created management layers that slowed decision-making.
More employees mean longer communication chains, more bureaucracy, and weaker worker motivation. Decisions take longer, mistakes go unnoticed, and the firm loses the agility of a smaller competitor.
Diseconomies explain why the LRAC curve eventually slopes upward and why some industries favour smaller firms.
Three causes — communication, coordination and worker alienation — each developed to the rising average cost it produces, with HSBC's repeated restructuring as application. It is Level 3 because the causes are explained and not assessed. A Level 4 needs a brief assessment: diseconomies are not inevitable at scale, since better information systems and decentralised divisions can postpone them, so how a firm is organised matters as much as how large it is.
Supernormal (abnormal) profit is any profit above the normal level — earned when AR > AC. K In perfect competition, supernormal profit attracts new entrants who compete it away. In monopoly, barriers to entry protect supernormal profit in the long run. A
Clear definitions with the AR = AC / AR > AC conditions correctly stated. The key insight — that normal profit includes opportunity cost — is essential. Linking to market structures (competition vs monopoly) shows broader understanding.
Competition policy uses regulation, merger control, and anti-trust enforcement to prevent firms from exploiting market power.
E.g. the CMA blocked Microsoft's initial attempt to acquire Activision Blizzard in 2023 over cloud gaming competition concerns.
Blocking anti-competitive mergers preserves choice. Breaking up cartels restores competition. Price caps on natural monopolies prevent exploitation while maintaining scale efficiencies.
Effective competition policy increases allocative efficiency and protects consumer welfare.
Three instruments — merger control, anti-cartel enforcement and price capping — each with a chain ending in allocative efficiency, and the Microsoft/Activision and truck cartel examples are current and well chosen. It sits at Level 3 because the instruments are described as working and never assessed. A Level 4 needs a brief assessment of their limits: investigations run for years, tacit collusion is very hard to prove, and blocking a merger can forgo real economies of scale that would have reached consumers as lower prices.
For example, if the UK has a lower opportunity cost of producing financial services and Bangladesh has a lower opportunity cost of producing textiles, both countries gain by specialising and trading. A Total global output increases because each country focuses resources on what it does relatively best, then exchanges for everything else. A
Correctly defines comparative advantage as lower opportunity cost (not lower absolute cost — a common student error). The UK/Bangladesh example makes the concept concrete. The key insight — that even the less efficient country benefits — is what distinguishes good answers.
Depreciation makes exports cheaper and imports more expensive, potentially improving the current account — but only if demand is sufficiently elastic.
E.g. the UK pound fell 15% after the 2016 Brexit vote, initially worsening the trade balance before gradually improving export competitiveness.
In the short run, existing trade contracts are at old prices and demand is inelastic — the current account worsens (J-curve). Over time, demand adjusts — if PED exports + PED imports > 1, the current account improves.
Whether depreciation helps depends on the Marshall-Lerner condition and how long it takes for demand to adjust.
Three concepts are integrated rather than listed: the competitiveness mechanism, the Marshall-Lerner condition and the J-curve lag, with sterling's fall after the 2016 referendum as application and a J-curve diagram available for the diagram credit. Level 4 is earned because the improvement is never asserted — it is made conditional on the combined elasticities, the inelastic case in which the current account worsens is stated, and the 12–24 month adjustment is given. That is the brief assessment.