
5 multiple-choice questions
1On an aggregate supply diagram, the vertical axis measures:
2Real national output is used on the horizontal axis because it is:
3In the short run, the aggregate supply curve slopes upward mainly because:
4The world price of energy rises sharply. Every firm in an economy uses energy to produce its output, and nothing else changes. What happens to the economy's SRAS curve?
5Productivity is best defined as:
The definition examiners want
Define the term 'aggregate supply'.
Say it out loud or jot it down first. Then check it against the mark scheme.
Two marks means two separate things to say. Decide what is being added up, and then what it is being measured against — a definition that leaves out the second has described a total, not a curve.
Aggregate supply is the total real output that all firms in an economy plan to produce (1 mark) at each possible price level over a given period (1 mark). An answer that says only "total output" or "total supply in the economy" has the first mark and not the second.
The diagrams to know
Step through each one, then try drawing it yourself.
Movement Along and Shift of AS
The upward-sloping SRAS curve, a movement along it when the price level changes, and a shift of it when costs change.
A movement along the SRAS curve. Price level 100 → 104: output $800bn → $820bn. Same curve: only the price level changed.
What Shifts SRAS
A change in the costs of raw materials and energy, in the exchange rate and in tax rates, each moving the SRAS curve through unit costs.
Energy prices rise. Unit costs up 5%: SRAS moves up 5 points. At 100: $775bn instead of $800bn.
Classical and Keynesian LRAS
The Keynesian LRAS with its three ranges; the classical LRAS, vertical at capacity, where a change in the price level leaves output unchanged; and the classical adjustment after AD falls, with AD, SRAS and LRAS on one diagram.
The Keynesian LRAS: three ranges. Flat below $640bn: idle resources. Vertical at $800bn: every resource in use.
Aggregate Supply diagrams to save
Open one full size, or save it to revise from.
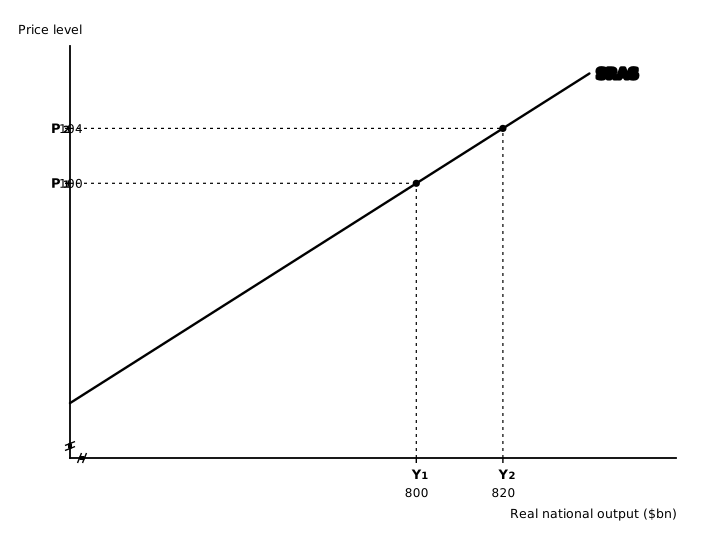
Movement Along and Shift of AS: Movement along SRAS 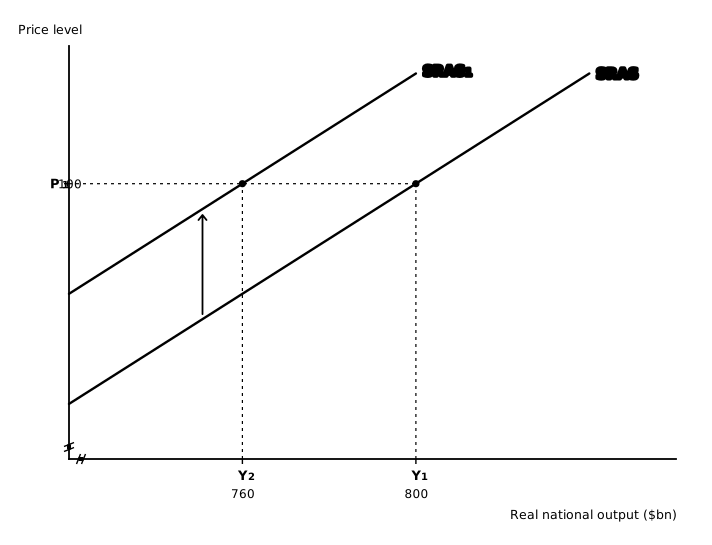
Movement Along and Shift of AS: Shift of SRAS 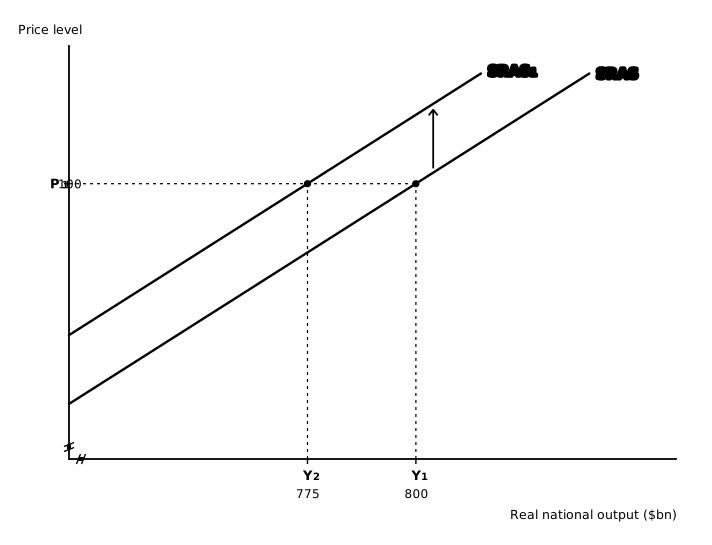
What Shifts SRAS: Raw materials and energy 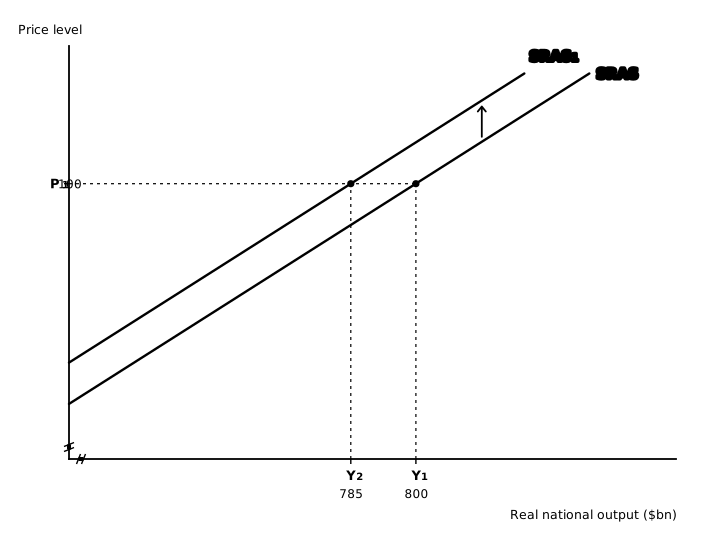
What Shifts SRAS: A depreciation 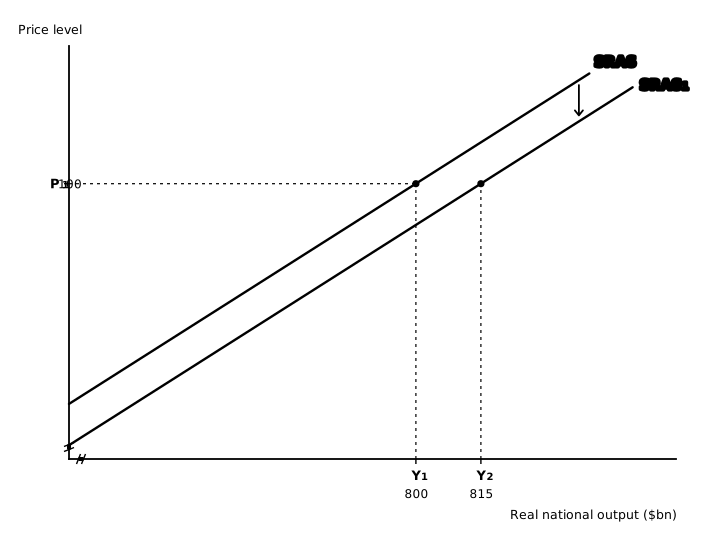
What Shifts SRAS: An appreciation 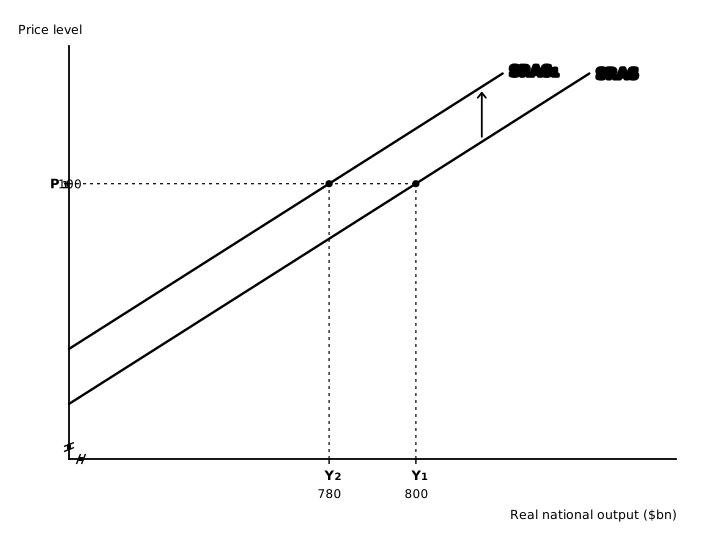
What Shifts SRAS: A tax rise 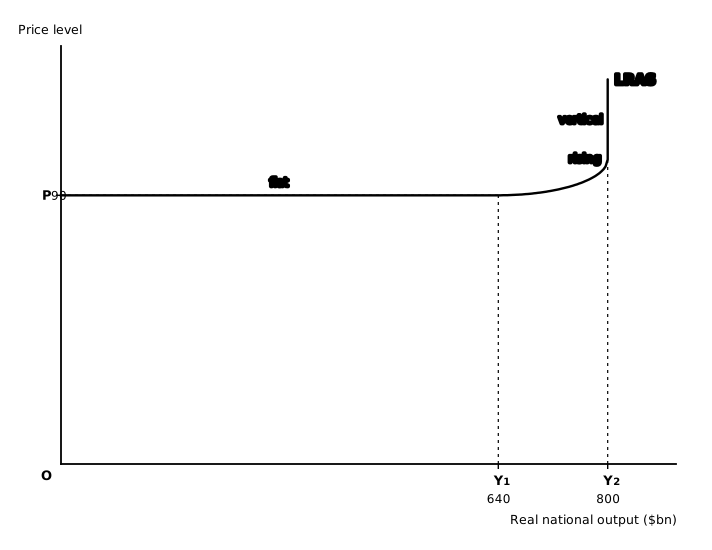
Classical and Keynesian LRAS: Keynesian: three ranges 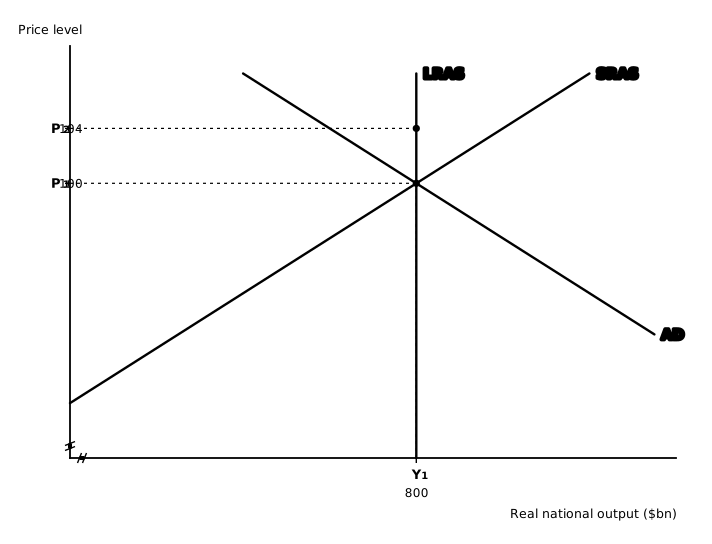
Classical and Keynesian LRAS: Classical: vertical 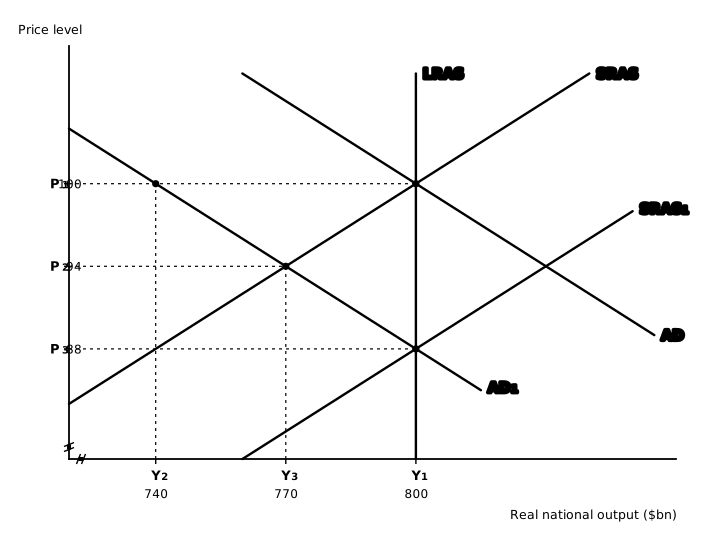
Classical and Keynesian LRAS: Classical adjustment
Worked calculations
Try it on paper first, then open the working.
Energy and raw materials make up 40% of firms' costs. Their price rises by 15%. Calculate the percentage change in firms' unit costs.
Appendix 6 defines Calculate as working from given data with the workings shown. Before multiplying anything, ask how much of a firm's costs the input actually is — the question gives you that for a reason.
Change in unit costs = share of costs × change in the input's price = 0.4 × 15% (1 mark) = a 6% rise (1 mark). The common error is to answer 15%, which assumes energy and raw materials are the whole of firms' costs.
Imported inputs make up 25% of firms' costs and energy makes up 20%. The currency depreciates so that imported inputs cost 12% more, while the price of energy falls by 5%. Calculate the overall change in unit costs and state the direction in which the SRAS curve shifts.
Two inputs are moving in opposite directions, so work out each effect separately before combining them, and keep the signs. The question also asks for a direction, which is a separate mark from the arithmetic.
Imported inputs: 0.25 × 12% = +3% (1 mark). Energy: 0.20 × (−5%) = −1% (1 mark). Overall change in unit costs = +3% − 1% = +2% (1 mark). Unit costs have risen at every level of output, so the SRAS curve shifts left (1 mark). A candidate who adds 12% and 5% without the shares, or ignores the sign of the energy change, has only the direction mark available.
A 6-mark Analyse question
Analyse the likely effect of a depreciation of a country's currency on its short-run aggregate supply.
0 words
Questions students ask
Within the context of Keynesian LRAS, what is spare capacity?
Spare capacity means the economy could produce more with the resources it already has, because some workers and machines are not being used. On the Keynesian LRAS curve, lots of spare capacity gives the flat part: real output can rise with no rise in the price level. As spare capacity is used up, costs rise, so the curve slopes upward. When there is no spare capacity left, the curve is vertical at full employment.
What shifts the SRAS curve?
A change in firms’ costs of production. A rise in the price of oil or another raw material, a fall in the exchange rate that makes imported materials more expensive, or higher taxes that raise firms’ costs (such as indirect taxes) shift SRAS to the left. Lower costs shift it to the right. A change in the price level moves along the curve instead.
What is the difference between SRAS and LRAS?
SRAS shows how much firms supply at each price level while their costs stay the same, and it shifts when costs change. LRAS shows the economy’s productive capacity: the most it can produce. It shifts when technology, productivity, or the quantity or quality of the factors of production change.
When is the aggregate supply curve vertical?
The classical LRAS curve is always vertical, at the economy’s maximum potential output: classical economists believe the economy always returns there in the long run. The Keynesian LRAS curve is vertical only at full employment, when all the factors of production are in use and output cannot rise any more.
Test me on all of Aggregate Supply
Every quiz question on the topic, not just the five above.
When you’re done
Edexcel IAL WEC12 · Spec 2.3.3 · A-Level Economics