
4 multiple-choice questions
1Which of the following would cause a leftward shift of the demand curve for butter?
2A product has a YED of +2.5. This means the good is:
3When real incomes in Pellara fell by 5%, sales of second-hand school uniforms rose by 4%. The uniforms are:
4Sorrel Bakery could sell 20% more loaves a week by cutting its price, but its profit would fall. Economics assumes the bakery will:
The definition examiners want
Define the term 'utility'.
Say it out loud or jot it down first. Then check it against the mark scheme.
Utility is the satisfaction a consumer gains from consuming a good or service, and it is what a rational consumer is assumed to aim to maximise when deciding what to buy.
Utility belongs to the consumer, not to the good. It is personal and cannot be measured the way a price can, so two people can gain very different utility from the same good. That is why "usefulness" is not the same thing: a good can be useful and still give a particular consumer little satisfaction.
Where the marks come from
- 1 Utility identified as the satisfaction, or benefit, a consumer gains from consuming a good or service
- 1 Linked to rational choice: utility is what a rational consumer is assumed to aim to maximise
The diagrams to know
Step through each one, then try drawing it yourself.
Marginal and Total Utility
Amara, a Tafari passenger, values her first coach trip in a month at $26, her second at $18, her third at $11 and her fourth at $5: her marginal utility falls with each extra trip. Her total utility still rises, from $26 to $44, $55 and $60, but by a smaller amount each time.
A Movement Along the Demand Curve
Tafari Coaches' demand curve, D. A change in the fare itself moves along the same curve: a fare cut from $20 to $15 is an extension, from 400 to 600 tickets a day; a fare rise from $10 to $12 is a contraction, from 800 to 720 tickets a day.
Extension: the fare falls, quantity demanded rises. A fare cut from $20 to $15 is an extension, from 400 to 600 tickets a day.
A Shift of the Demand Curve
Tafari's demand curve moves when something other than its own fare changes. A rise in the air fare on the route shifts it right, from D1 to D2: at the unchanged fare of $15, 840 tickets a day are wanted instead of 600. Dearer hotel rooms at the destination shift it left, from D1 to D3: 360 tickets instead of 600.
The air fare on the route rises. Tafari's own fare stays the same. Something other than the fare changed: more tickets are wanted at every fare. At $15: 600 → 840.
Reading YED: the Sign, Then the Size
A scale of income elasticity of demand from −1 to 3. The sign comes first: negative is an inferior good, positive a normal good. Then the size against 1: between 0 and 1 is a necessity (income inelastic), above 1 a luxury (income elastic). Coach tickets (−0.5), rice (+0.4) and air tickets (+2) are plotted on it.
Consumer Behaviour and Demand diagrams to save
Open one full size, or save it to revise from.
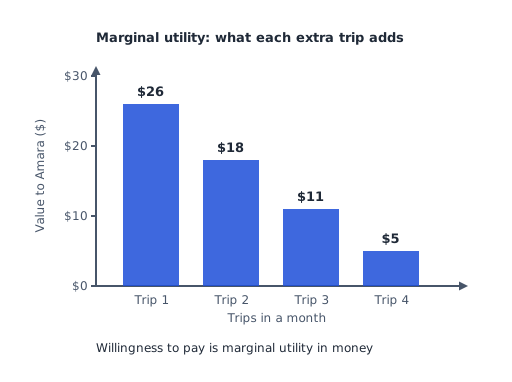
Marginal and Total Utility: Marginal utility falls 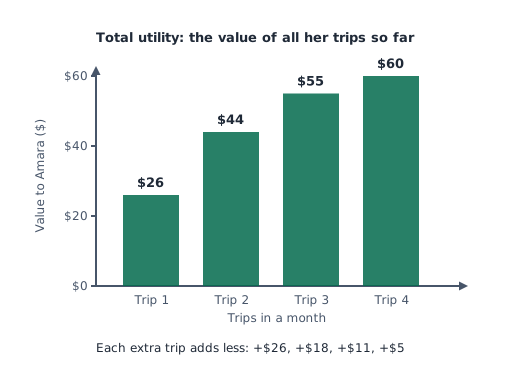
Marginal and Total Utility: Total utility rises by less each time 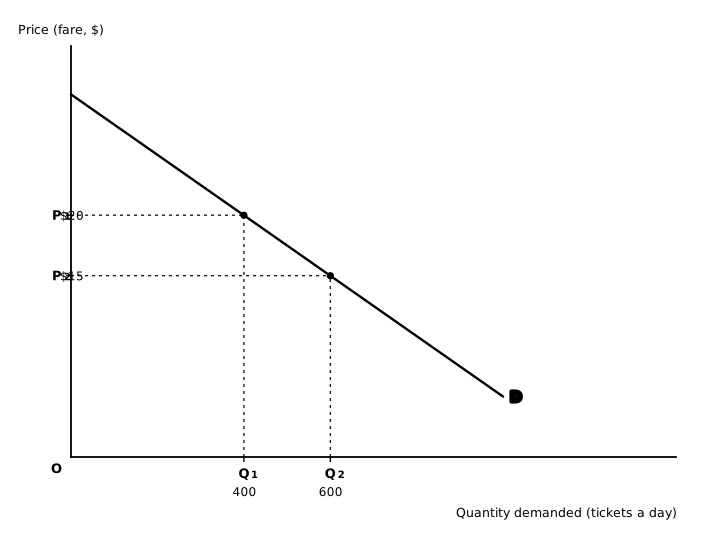
A Movement Along the Demand Curve: Extension (the fare falls) 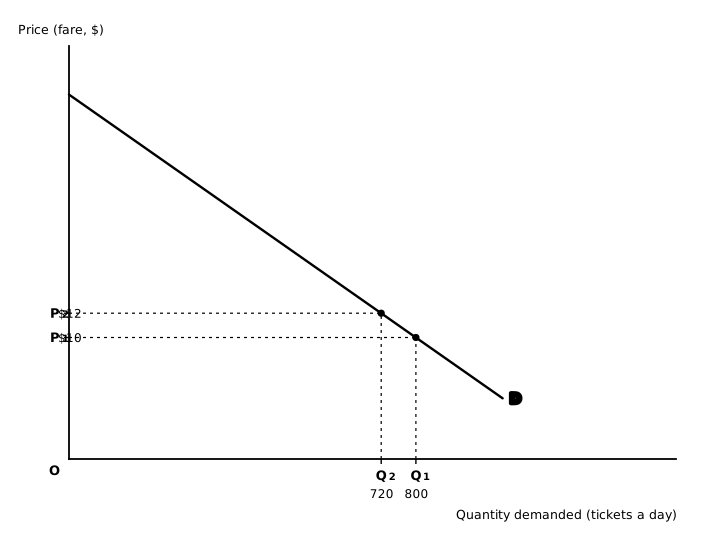
A Movement Along the Demand Curve: Contraction (the fare rises) 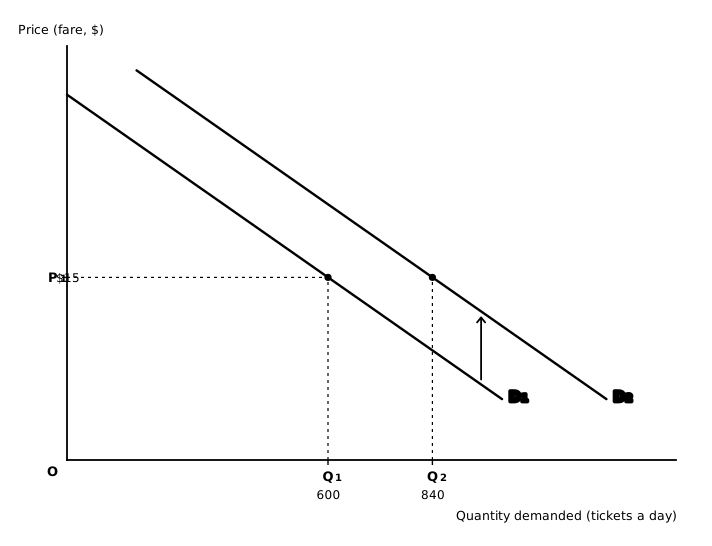
A Shift of the Demand Curve: An increase in demand 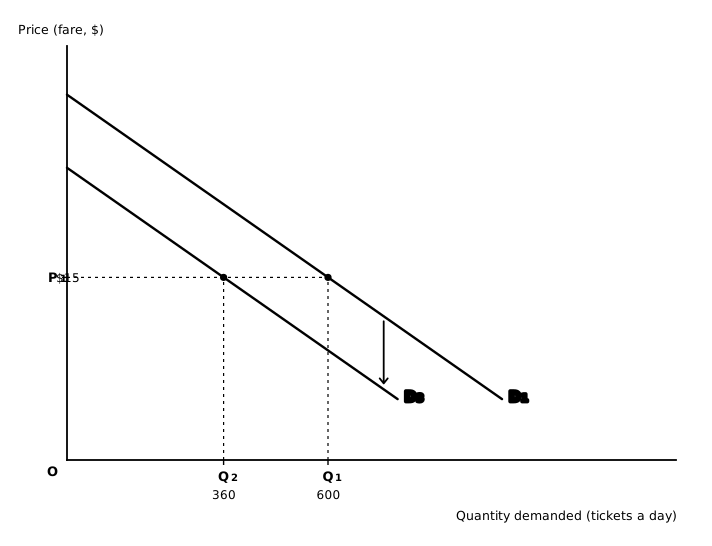
A Shift of the Demand Curve: A decrease in demand 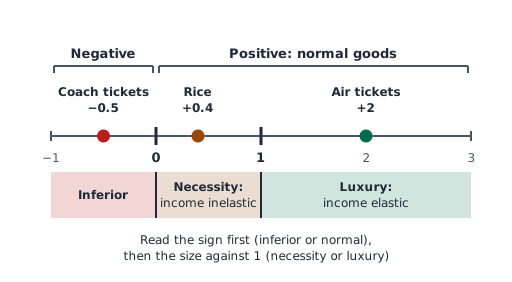
Reading YED: the Sign, Then the Size
An 8-mark Examine question
Examine the significance of income elasticity of demand for a supermarket group planning for a period of falling real incomes.
How to approach it: Start from what the measure is and what its sign separates, then sort the group’s product ranges by it and follow a fall in real income through each. Finish by weighing how far the group can rely on the estimates when it plans.
0 words
Questions students ask
What are unrelated goods?
Two goods are unrelated when a change in the price of one has no effect on the demand for the other. Their cross elasticity of demand (XED) is zero. For example, a rise in the price of bread will not change the demand for car tyres.
How do you calculate cross elasticity of demand (XED)?
XED = % change in quantity demanded of good A ÷ % change in price of good B. A positive answer means the goods are substitutes (like tea and coffee). A negative answer means they are complements (like printers and ink). An answer of zero means they are unrelated.
What is the difference between total utility and marginal utility?
Total utility is all the satisfaction a person gets from the units they consume. Marginal utility is the extra satisfaction from one more unit. Example: the first slice of pizza gives a lot of satisfaction, the fourth gives much less. Total utility still rises while marginal utility is positive, but more and more slowly.
What does a marginal utility diagram show?
It shows the number of units consumed on the horizontal axis and marginal utility on the vertical axis. The line slopes down from left to right: each extra unit gives less extra satisfaction. Because each extra unit is worth less to the consumer, they will only buy more if the price falls. This is why the demand curve slopes downwards too.
Test me on all of Consumer Behaviour and Demand
Every quiz question on the topic, not just the four above.
When you’re done
Edexcel IAL WEC11 · Spec 1.3.2 · A-Level Economics