
5 multiple-choice questions
1The trend rate of growth is best described as:
2Which of these is an example of potential economic growth?
3On a production possibility frontier, actual growth that uses spare capacity is shown by:
4With spare capacity in the economy, a rise in which of these would cause actual growth through aggregate demand?
5Real GDP rises by 3% while the population rises by 4%. Real GDP per head has:
The definition examiners want
Define the term 'potential economic growth'.
Say it out loud or jot it down first. Then check it against the mark scheme.
A definition has two parts to it, so say what increases and then say what that thing means. Be careful not to define actual growth by mistake: the two terms are the pair most often swapped.
An increase in an economy's productive capacity (1 mark), meaning the real output it could produce if all its resources were fully and efficiently employed (1 mark). "An increase in real GDP" defines actual growth and earns nothing here; "when LRAS shifts right" or "when the PPF shifts out" describes how it is shown, which can support a definition but does not replace one.
The diagrams to know
Step through each one, then try drawing it yourself.
Actual and Potential Growth
IAL 2.3.5 · 1a: actual growth as a move from A, inside the PPF, to B on it; potential growth as an outward shift of the frontier, from B to C.
Actual and potential growth on the PPF. A to B: actual growth, idle resources used. B to C: potential growth, the frontier shifts out.
Potential Growth: Long-Run AS Shifts Right
IAL 2.3.5 · 1d, 1e: potential growth raises full-capacity output, so the Keynesian long-run AS curve shifts right and real output rises from Y₁ to Y₂.
Capacity rises: LRAS shifts right. Output rises from Y₁ to Y₂. More workers, or more output per worker.
Output Gaps: Actual and Potential Output
IAL 2.3.5 · 4a, 4b: Elvesta's potential output growing 2.5% a year from Year 1 to Year 9, actual output below it and then above it, with a negative output gap of −2% in Year 3 and a positive output gap of +2% in Year 7.
Economic Growth diagrams to save
Open one full size, or save it to revise from.
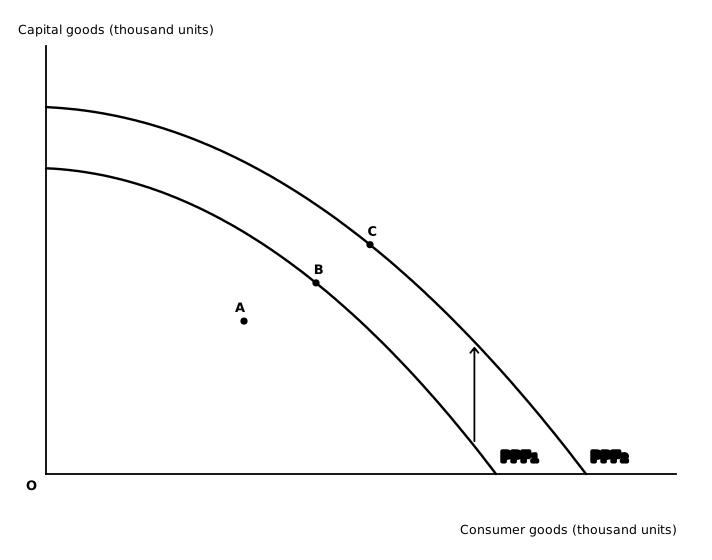
Actual and Potential Growth 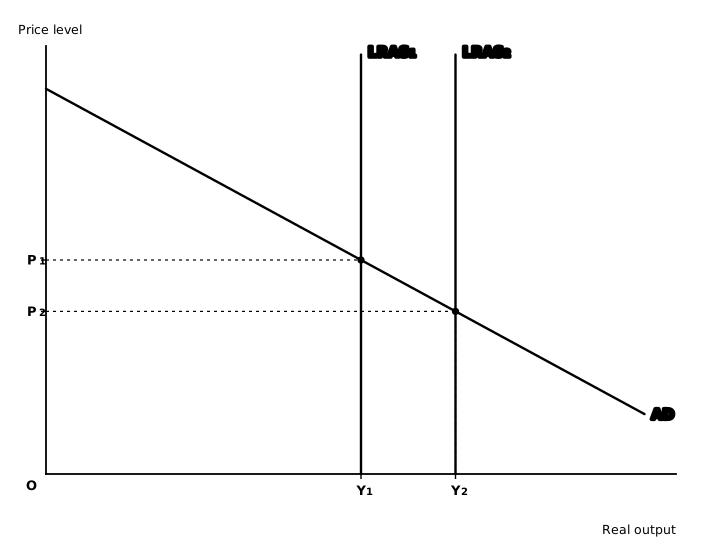
Potential Growth: Long-Run AS Shifts Right 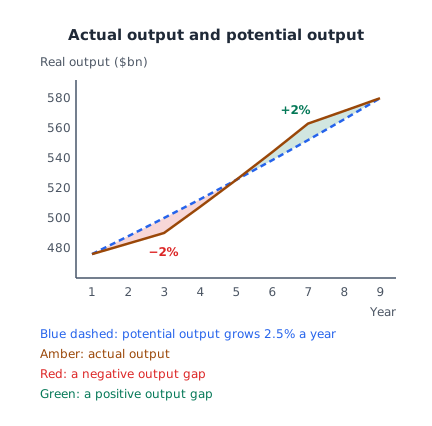
Output Gaps: Actual and Potential Output
Worked calculations
Try it on paper first, then open the working.
Loriana has 20 million workers, each producing $25,000 of output a year. Next year its labour force grows by 0.5% and output per worker by 2%. Calculate the percentage growth in Loriana's productive capacity, to two decimal places.
Productive capacity is the number of workers multiplied by what each produces, so work out this year's figure and next year's figure separately before comparing them. Keep the units straight throughout: workers are in millions and output per worker is in dollars.
Stage 1 — this year's capacity: 20 million × $25,000 = $500bn (1 mark). Stage 2 — next year's inputs: 20.1 million workers and $25,500 per worker (1 mark). Stage 3 — next year's capacity: 20.1 million × $25,500 = $512.55bn (1 mark). Stage 4 — growth: ($512.55bn − $500bn) ÷ $500bn × 100 = 2.51% (1 mark). Adding the two growth rates gives 2.5%, which is close but not the answer to two decimal places; the product of the two growth factors is exact.
Tax revenue in an economy is 20% of GDP. Real GDP rises from $490bn to $507.4bn and no tax rate changes. Calculate the increase in tax revenue.
Work out revenue at each level of GDP using the same share, then compare the two, rather than trying to find the increase in one step. Set out each line so that the method is visible.
Revenue before: 20% × $490bn = $98bn; revenue after: 20% × $507.4bn = $101.5bn (1 mark). Increase: $101.5bn − $98bn = $3.5bn (1 mark). An answer of $17.4bn has found the rise in GDP, not in revenue.
A 6-mark Analyse question
Analyse how foreign direct investment may increase an economy's potential growth.
0 words
Questions students ask
What is the difference between actual and potential economic growth?
Actual growth is an increase in real GDP: the economy produces more. Potential growth is an increase in the economy’s capacity: it could produce more. On a PPF, actual growth is a move from a point inside the frontier towards it, and potential growth is an outward shift of the frontier.
What is Yfe in economics?
Yfe is full-employment output: the real output an economy produces when all its factors of production are in use. On a Keynesian LRAS diagram it is where the curve becomes vertical. Potential growth moves Yfe to the right.
How is economic growth measured?
As the percentage change in real GDP, usually over a year: the change in real GDP ÷ last year’s real GDP × 100. Real GDP takes out the effect of inflation. For example, real GDP rising from $400bn to $412bn is growth of 12 ÷ 400 × 100 = 3%.
Can economic growth cause inflation?
Yes, when AD grows faster than the economy’s capacity. As spare capacity is used up, firms’ costs rise and the price level rises with output. Growth that comes from more capacity (potential growth, with LRAS shifting right) can raise output without pushing up prices.
Test me on all of Economic Growth
Every quiz question on the topic, not just the five above.
When you’re done
Edexcel IAL WEC12 · Spec 2.3.5 · A-Level Economics