
5 multiple-choice questions
1In Norla, the price of a brick rises by 20% and stays at the new level. Within a month, the quantity of bricks supplied rises by 5%. After three years, it is 40% higher than before the price rise. Nothing else changes. PES moves from:
2Which phrase correctly describes a rightward shift of the supply curve?
3The price of a good rises, with nothing else changing. This causes:
4A price elasticity of supply of 0.4 tells you that:
5Which of these would make the supply of a good more price elastic?
The definition examiners want
Define the term 'supply'.
Say it out loud or jot it down first. Then check it against the mark scheme.
The quantity of a good that producers are willing and able to offer for sale (1 mark), at a given price in a given time period (1 mark). Both qualifiers are needed: without them the definition describes a stock rather than a rate.
The diagrams to know
Step through each one, then try drawing it yourself.
Supply: Movements Along the Curve and Shifts of It
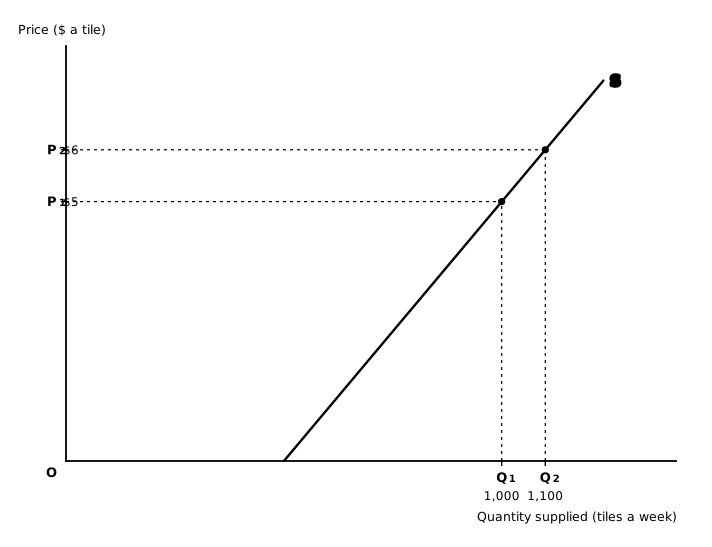
Two views of Mirelo Tiles' supply. A change in the price of a tile moves Mirelo along S: from A ($5, 1,000 tiles a week) to B ($6, 1,100), so the quantity supplied extends. A change in anything else shifts the curve: dearer clay gives S₂ (800 at $5), the new firing method gives S₁ (1,200 at $5).
A movement along the supply curve. The price of a tile rises from $5 to $6 and nothing else changes, so Mirelo moves up along S from A to B: the quantity supplied extends from 1,000 to 1,100 tiles a week.
What Shifts the Supply Curve: Taxes and Subsidies
Three ways the national government moves Mirelo's supply curve. A specific tax of $1 a tile lifts S by $1 at every quantity, so S + tax is parallel. An ad valorem tax of 20% adds $0.60 at 800 tiles, $1 at 1,000 and $1.40 at 1,200, so S + 20% tax is steeper. A subsidy of $1 a tile moves S down by $1, so when buyers pay $5 the quantity supplied is 1,100.
A specific tax of $1 a tile. Gap at every quantity: $1. To supply 1,000 tiles Mirelo now needs $6 from buyers, not $5: $1 goes to the national government. When the price buyers pay is $6, the price Mirelo keeps is $5, so the quantity supplied is 1,000, not 1,100. S + tax lies $1 above S at every quantity, so it stays parallel.
Price Elasticity of Supply: The Five Values
The five values of price elasticity of supply, each with the shape it gives the curve: vertical for perfectly inelastic, horizontal for perfectly elastic, a straight line through the origin for unitary elastic, and upward-sloping lines for inelastic and elastic supply.
PES = 0
PES < 1
PES = 1
PES > 1
PES = ∞
A unitary elastic supply curve is any straight line through the origin, whatever its slope.
Supply diagrams to save
Open one full size, or save it to revise from.
Supply: Movements Along the Curve and Shifts of It: A movement along 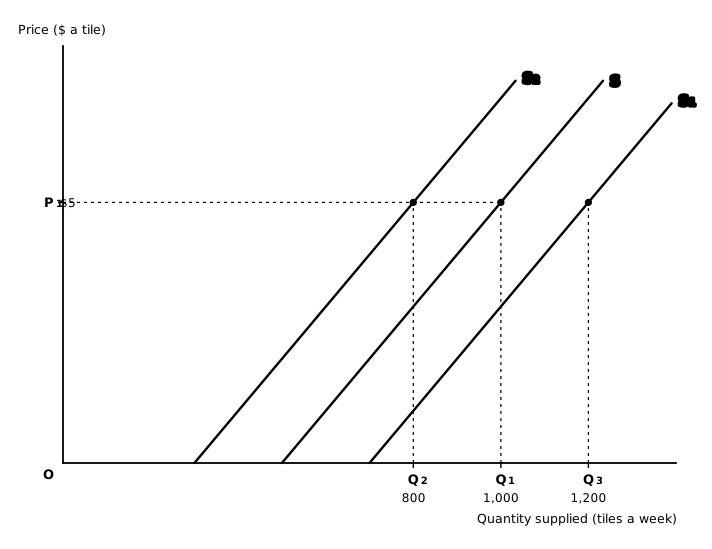
Supply: Movements Along the Curve and Shifts of It: A shift of the curve 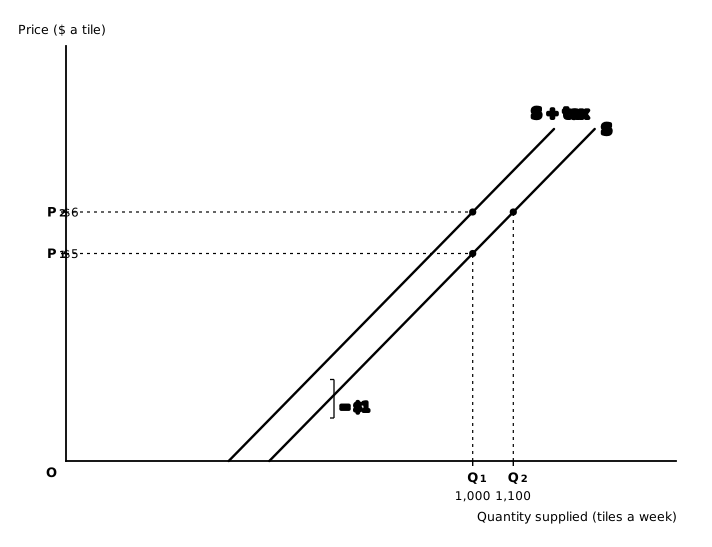
What Shifts the Supply Curve: Taxes and Subsidies: A specific tax 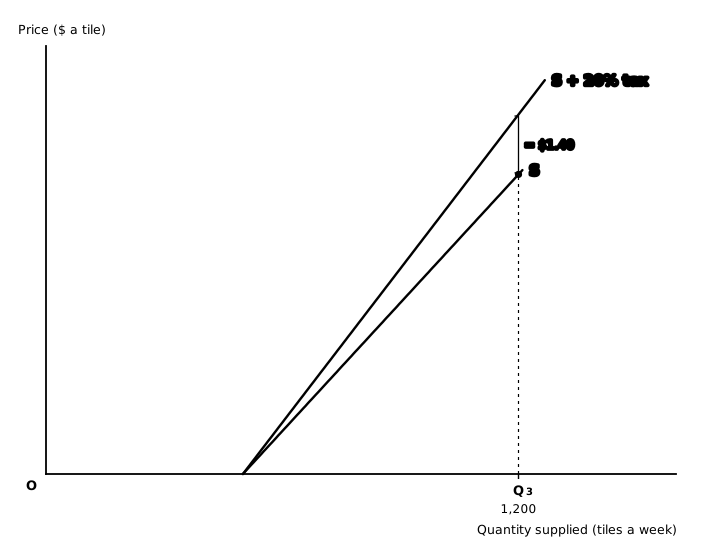
What Shifts the Supply Curve: Taxes and Subsidies: An ad valorem tax 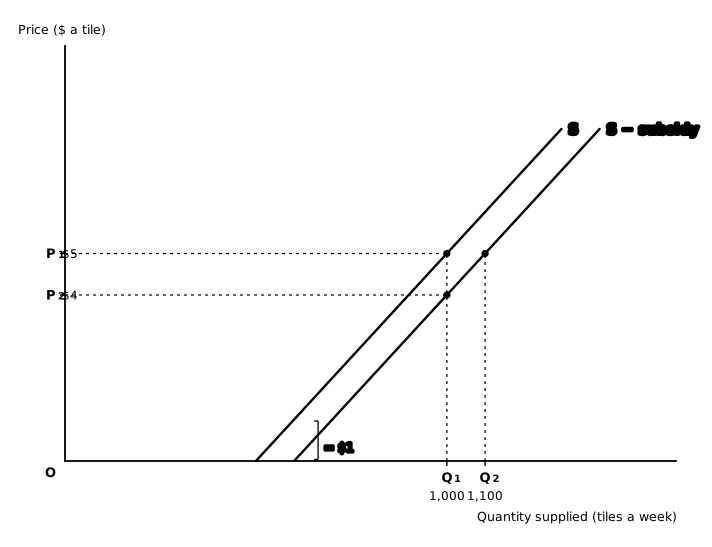
What Shifts the Supply Curve: Taxes and Subsidies: A subsidy 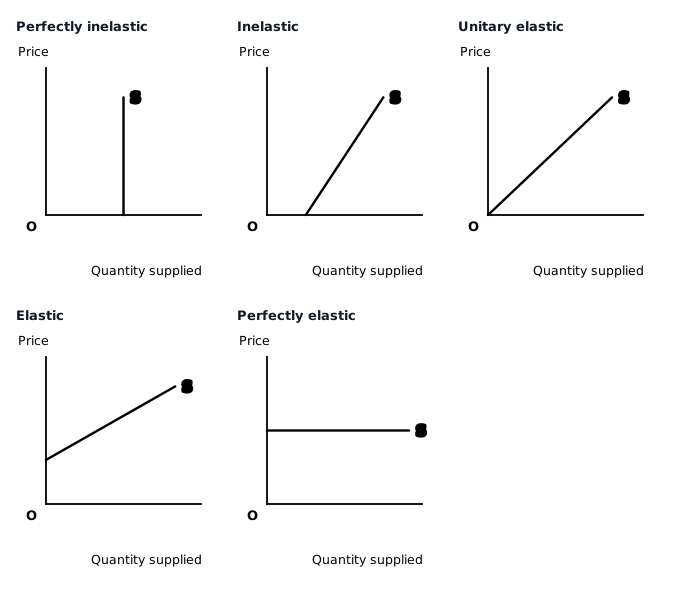
Price Elasticity of Supply: The Five Values
Worked calculations
Try it on paper first, then open the working.
The price of a good rises from $8 to $10. Quantity supplied rises from 400 to 460 units a week. Calculate the price elasticity of supply and interpret the value.
Percentage change in quantity supplied: 60 ÷ 400 × 100 = 15% (1 mark). Percentage change in price: $2 ÷ $8 × 100 = 25% (1 mark). PES = 15% ÷ 25% = 0.6 (1 mark). Interpretation: the value is below 1, so supply is price inelastic — quantity supplied changed by proportionally less than price (1 mark). Appendix 6 advises showing workings, which is what allows the percentage stages to be credited even if the final division goes wrong.
A 6-mark Analyse question
Analyse two factors that could cause the supply curve for cement to shift to the left.
0 words
Questions students ask
What causes the supply curve to shift?
A change in anything other than the good’s own price: these are the determinants of supply. Supply shifts right with higher productivity, better technology, cheaper raw materials or labour, a subsidy, or more firms in the industry. It shifts left with the opposite, or when a tax is imposed.
What is the law of supply?
When the price of a good rises, the quantity supplied rises, so the supply curve slopes upwards from left to right. The reason: at a higher price, producers who aim to maximise profit supply more, because their profits should rise.
Can a supply curve be vertical?
Yes. A vertical supply curve means supply is perfectly inelastic (PES = 0): the quantity supplied does not change at all when the price changes. An example is the number of seats in a stadium for one match.
Test me on all of Supply
Every quiz question on the topic, not just the five above.
When you’re done
Edexcel IAL WEC11 · Spec 1.3.3 · A-Level Economics